This is the implementation playbook. It assumes your leadership has already bought in.
If they haven't, start with The Business Case for Risk-Based Vulnerability Prioritization.
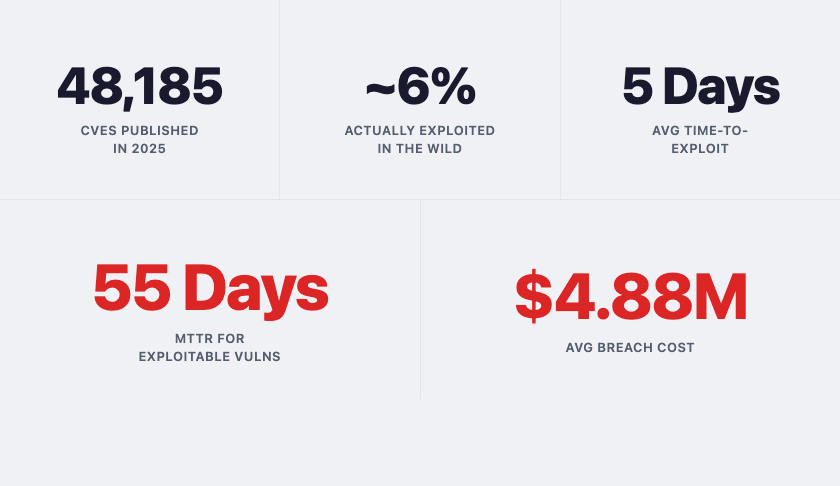
You've been told to move from CVSS-sorted patching to risk-based prioritisation. The methodology is sound, the data sources are free, and you don't need new tooling.
What you need is a structured process to score your assets, enrich your vulnerability data, and change how your team triages. This guide walks through that process in five phases.
Before you start, make sure you have:
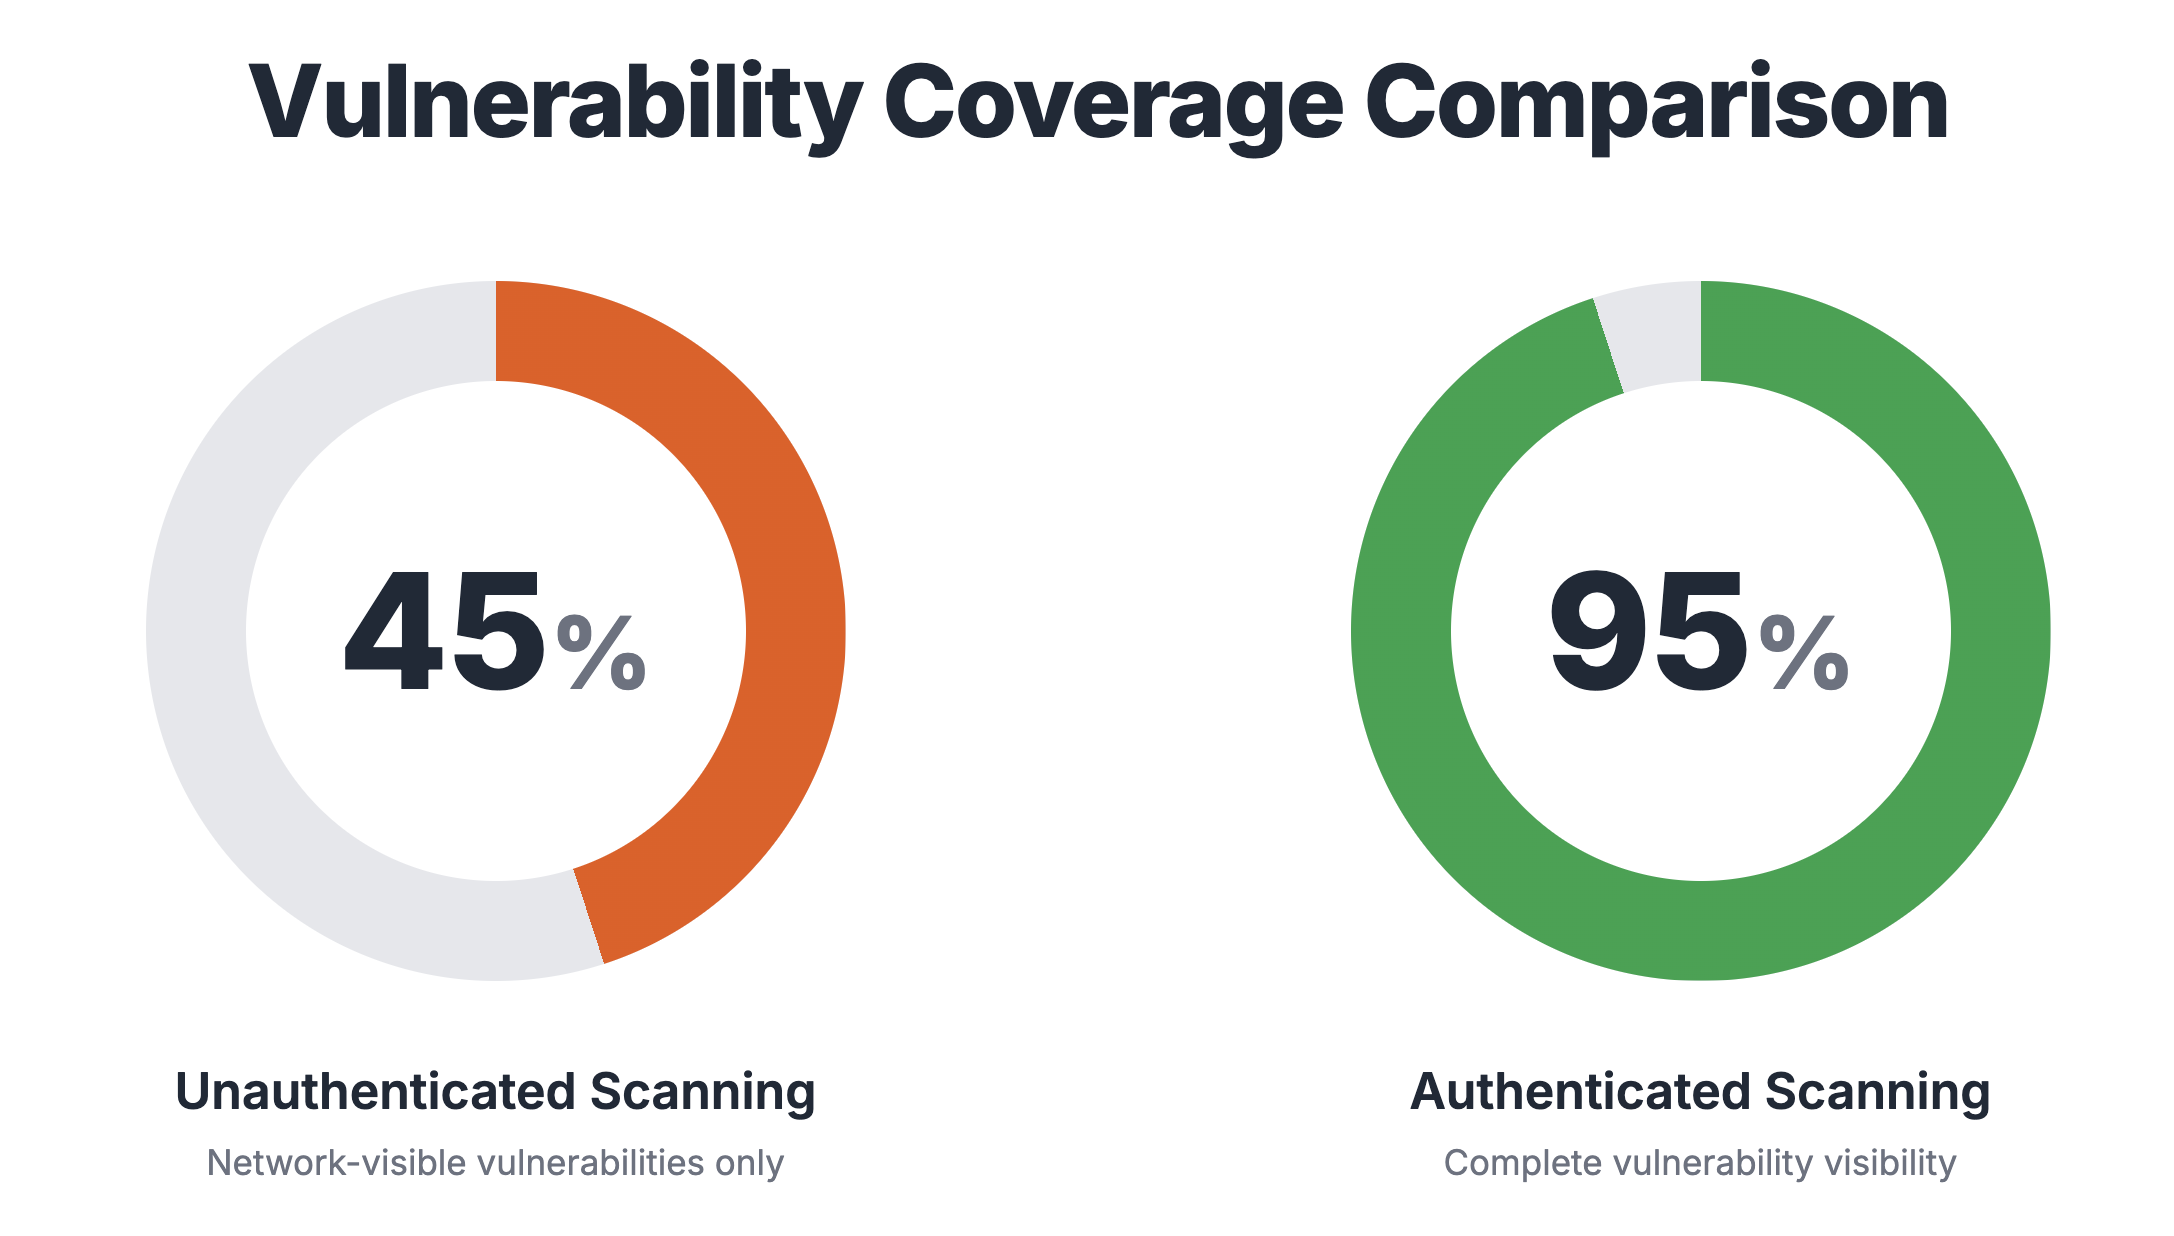
- A vulnerability scanner producing CVE-level findings across your environment
- An asset inventory — even a rough one. You need to know what's running and where
- Access to CISA KEV and EPSS data. Most enterprise scanners already surface this. If yours doesn't, both are free via API
- A business stakeholder who can tell you which systems matter. This is the hardest prerequisite. Without it, you'll guess at asset criticality and get it wrong
If any of these are missing, fix that first. Everything downstream depends on them.
Phase 1: Asset Criticality Scoring
This is where most implementations fail. Not because it's technically difficult — because security teams try to do it alone.
You cannot score asset criticality from the security team's perspective.
A database server means nothing without knowing what business service it supports. Your payment processing database and your dev test database are both PostgreSQL on Linux.
One is a 5/5, the other is a 1/5.
Start with services, not servers
Don't try to score 10,000 assets individually.
Identify your business services first — payment processing, customer portal, HR platform, ERP, email — and score those. The assets underneath inherit the score.
Most organisations have 30–60 business services that matter. That's your scoring list.
How to score
For each business service, score four criteria on a 1–5 scale:
- Revenue impact — what does a 24-hour outage cost financially?
- Data sensitivity — what's the worst-case data exposure?
- Business dependency — how many teams are blocked without it?
- Operational continuity — what does downtime cost per hour?
Use the worksheet below to score your services — or try a sample to see how the scoring changes.
Every asset supporting that service — app servers, databases, load balancers, API gateways — gets the service's score. If an asset supports multiple services, it inherits the highest.
Getting the scores
The business owns these scores, not security.
Pre-populate a list of services you already know about, and have the business unit owners validate and score them.
When everything gets rated a 5, force-rank: "If this and the payment gateway both go down, which gets fixed first?"
Shared services like Active Directory, DNS, and email — score those with IT ops.
Once agreed, tag the scores in your vulnerability management platform using a consistent taxonomy like criticality:5, criticality:4 — that's what drives your workflow downstream.
Common mistakes
- Trying to score every asset individually instead of scoring services and inheriting
- Skipping the business conversation and guessing from the security team
- Over-engineering the taxonomy with 15 categories instead of the 4 criteria - revenue impact, data sensitivity, business dependency, and operational continuity
- Not getting sign-off — if the business doesn't agree with the scores, they'll fight your SLAs later
Phase 2: Integrating Threat Intelligence
You have asset criticality scores. Now you need to know which vulnerabilities are actually being exploited.
Two data sources matter here:
CISA KEV — a catalogue of vulnerabilities confirmed exploited in the wild. Treat every KEV entry as urgent regardless of CVSS score.
EPSS — a machine learning model that predicts the probability of a vulnerability being exploited in the next 30 days. Scores range from 0% to 100%.
Most enterprise scanners already surface both. If yours does, this phase is about validating the data is flowing and understanding how to use it. If it doesn't, both are available via free public APIs.
How these fit together
CVSS tells you severity.
CISA KEV tells you what's confirmed and exploited.
EPSS tells you what's likely to be exploited soon.
None of them tell you whether the vulnerable asset matters to your business — that's what Phase 1 gave you.
The combination of CVSS, CISA KEV, EPSS, and Asset Criticality is your risk score:
| Condition | Risk Tier | SLA |
|---|---|---|
| KEV = Yes + Asset Criticality 4–5 | Critical | 24 hours |
| KEV = Yes + Asset Criticality 2–3 | High | 7 days |
| KEV = Yes + Asset Criticality 1 | Medium | 30 days |
| EPSS > 40% + Asset Criticality 4–5 | Critical | 24 hours |
| EPSS > 40% + Asset Criticality 1–3 | High | 7 days |
| EPSS 10–40% + Asset Criticality 4–5 | High | 7 days |
| EPSS 10–40% + Asset Criticality 1–3 | Medium | 30 days |
| EPSS < 10% + Asset Criticality 4–5 | Medium | 30 days |
| EPSS < 10% + Asset Criticality 1–3 | Low | 90 days |
The risk score from the calculator above feeds the tiers and SLAs in Phase 3.
Phase 3: Risk Tiers and SLAs
Now it is time to turn that into a system your team can work with.
Define four tiers
The risk scoring calculator in Phase 2 maps vulnerabilities and assets into four tiers. Each tier needs a clear SLA — timelines your team can meet.
Start conservative. If your current Mean Time To Remediate (MTTR) for critical vulnerabilities is 38 days, setting a 24-hour SLA on day one is setting your team up to fail.
Begin with what's achievable, measure compliance for 30 days, then tighten.
Handling exceptions
Not every vulnerability can be remediated within its SLA. The system breaks down if there's no legitimate way to say "we accept this risk for now."
Define a simple exception process:
- Who can approve (security lead for 30-day extensions, CISO for anything longer)
- Maximum duration before re-review
- What gets documented (the risk, the reason, the compensating controls, the expiry date)
Exceptions without expiry dates become permanent. Every exception gets a review date.
Run a pilot
Start with one business unit — ideally one with a mix of critical and low-criticality assets. Classify their backlog, apply SLAs, remediate Critical and High findings, and measure MTTR against the new targets.
The pilot gives you two things: proof that the model works, and the real-world data you need to adjust thresholds before going wider.
Phase 4: Remediation Workflow
Knowing what to fix first is half the problem. The other half is how your team actually works through it.
Patching isn't the only option
Not every vulnerability has a patch available on day one. And not every patch can be deployed immediately — change windows, dependencies, uptime requirements. Your team needs a decision path:
Verification
A vulnerability is considered remediated when a re-scan confirms it's gone.
Build verification into the workflow — either automated re-scans on a schedule or manual verification for Critical and High findings within 48 hours of the reported fix.
Ticket automation
If your scanner integrates with your ticketing system (ServiceNow, Jira), automate ticket creation for all findings. The risk tier sets the ticket priority and SLA. This removes the manual triage step that bottlenecks many teams.
Phase 5: Operationalise and Measure
Everything up to this point is a pilot. This phase makes it permanent.
Metrics that matter
Track four things:
- Mean Time to Remediate — measured separately by tier: Critical, High, Medium, Low
- SLA compliance rate — percentage of findings remediated within the target window
- Risk tier distribution over time — are your Critical and High findings reducing?
- Exception health — how many risk acceptances are past their review date?
Reporting
Your CISO needs a monthly view: MTTR trends, SLA compliance, exploitable exposure on critical assets.
The board needs a quarterly view: is our risk posture improving? Critical/High findings trend over time answers that.
The 90-day review
At the 90-day mark, you'll have enough operational data to know what's working and what isn't.
Three things tend to need adjustment:
- SLA targets that turned out to be unrealistic
- Scoring thresholds that aren't catching the right things
- Asset criticality scores that have gone stale because the business changed underneath them
Revisit these regularly.
Common Pitfalls
Boiling the ocean — Instead of scoring every asset before you start, score your top 20% by revenue, run the workflow on those, expand later.
Security scores assets alone — If the business didn't agree to the criticality scores, they'll fight the SLAs. Get sign-off in Phase 1.
EPSS as gospel — It's a probability model, not a certainty. A 5% EPSS score doesn't mean safe. It means less likely.
SLAs nobody can meet — Start with what's achievable and tighten quarterly. Unrealistic targets just get ignored.
No exception process — If there's no legitimate way to defer a fix, teams find workarounds.
No baseline measurement — If you didn't capture MTTR and backlog size before starting, you can't prove the improvement. Measure before you change anything.
Tools and Resources
- CISA KEV Catalog — full list and API
- EPSS by FIRST — scores and API documentation
- The Business Case for Risk-Based Vulnerability Prioritization — start here if leadership isn't bought in yet
Final Thoughts
No framework survives first contact with your environment unchanged. The thresholds will need tuning, the business will push back on scores, and your first set of SLAs will probably be wrong. That's expected.
The value isn't in getting every parameter right on day one. It's in having a structured model that connects vulnerability data to business risk.
Start with your top 20% of assets. Run the full workflow on one business unit. Measure everything from day one so you have a baseline to improve against. In 90 days you'll either have the data to prove it works, or the data to adjust until it does. Both are progress.
The exec post made the case for why this matters. This playbook gave you the implementation. The rest is execution.